Today, Consumer Packaged Goods companies must have the right insights at their fingertips for nearly every function to be successful. Trade Promotion Management and Optimization solutions house so much of the necessary data that it’s natural for them to also house comprehensive insights suites. In our CPGvision platform, we have developed the most comprehensive, out of the box, insights on the market. This includes over 40 standard reports across five strategic categories, each designed to empower different stakeholders within your organization.
1. Business Reports: The Executive Perspective
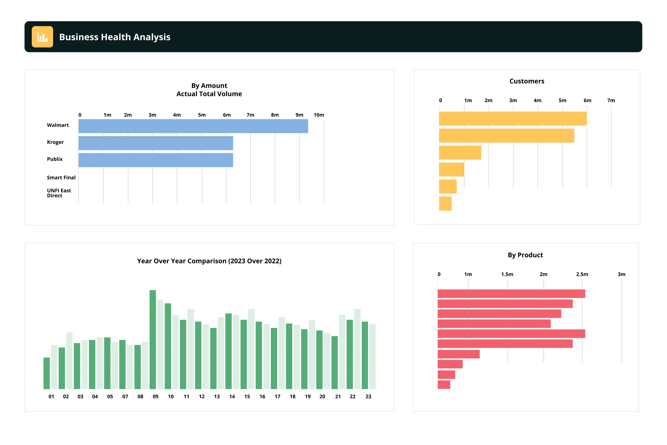
Business reports provide a holistic view of your entire operation while maintaining the flexibility to drill down into very granular levels of the account and product hierarchy. The Executive Dashboard, a standout feature in this category, delivers immediate visibility into your gross-to-net waterfall and account rankings based on revenue, volume and profit..
What sets these reports apart is their dynamic nature. Interactive charts and visualizations allow for quick analysis without the need to constantly change report parameters. Executives can assess overall business performance and then seamlessly drill into trouble spots or areas of opportunity.
"The Executive Dashboard gives me an immediate snapshot of where we stand across all accounts, but I can just as easily focus on a single account and its performance drivers," notes one CPG executive.
The full suite provides all the insights an executive or manager needs to understand business performance, including account P&Ls, plan rollup reports, monthly promotions and more. All with multiple views, filters, sorting, ranking and drill-down capabilities.
2. Forecast Reports: Prediction vs. Reality
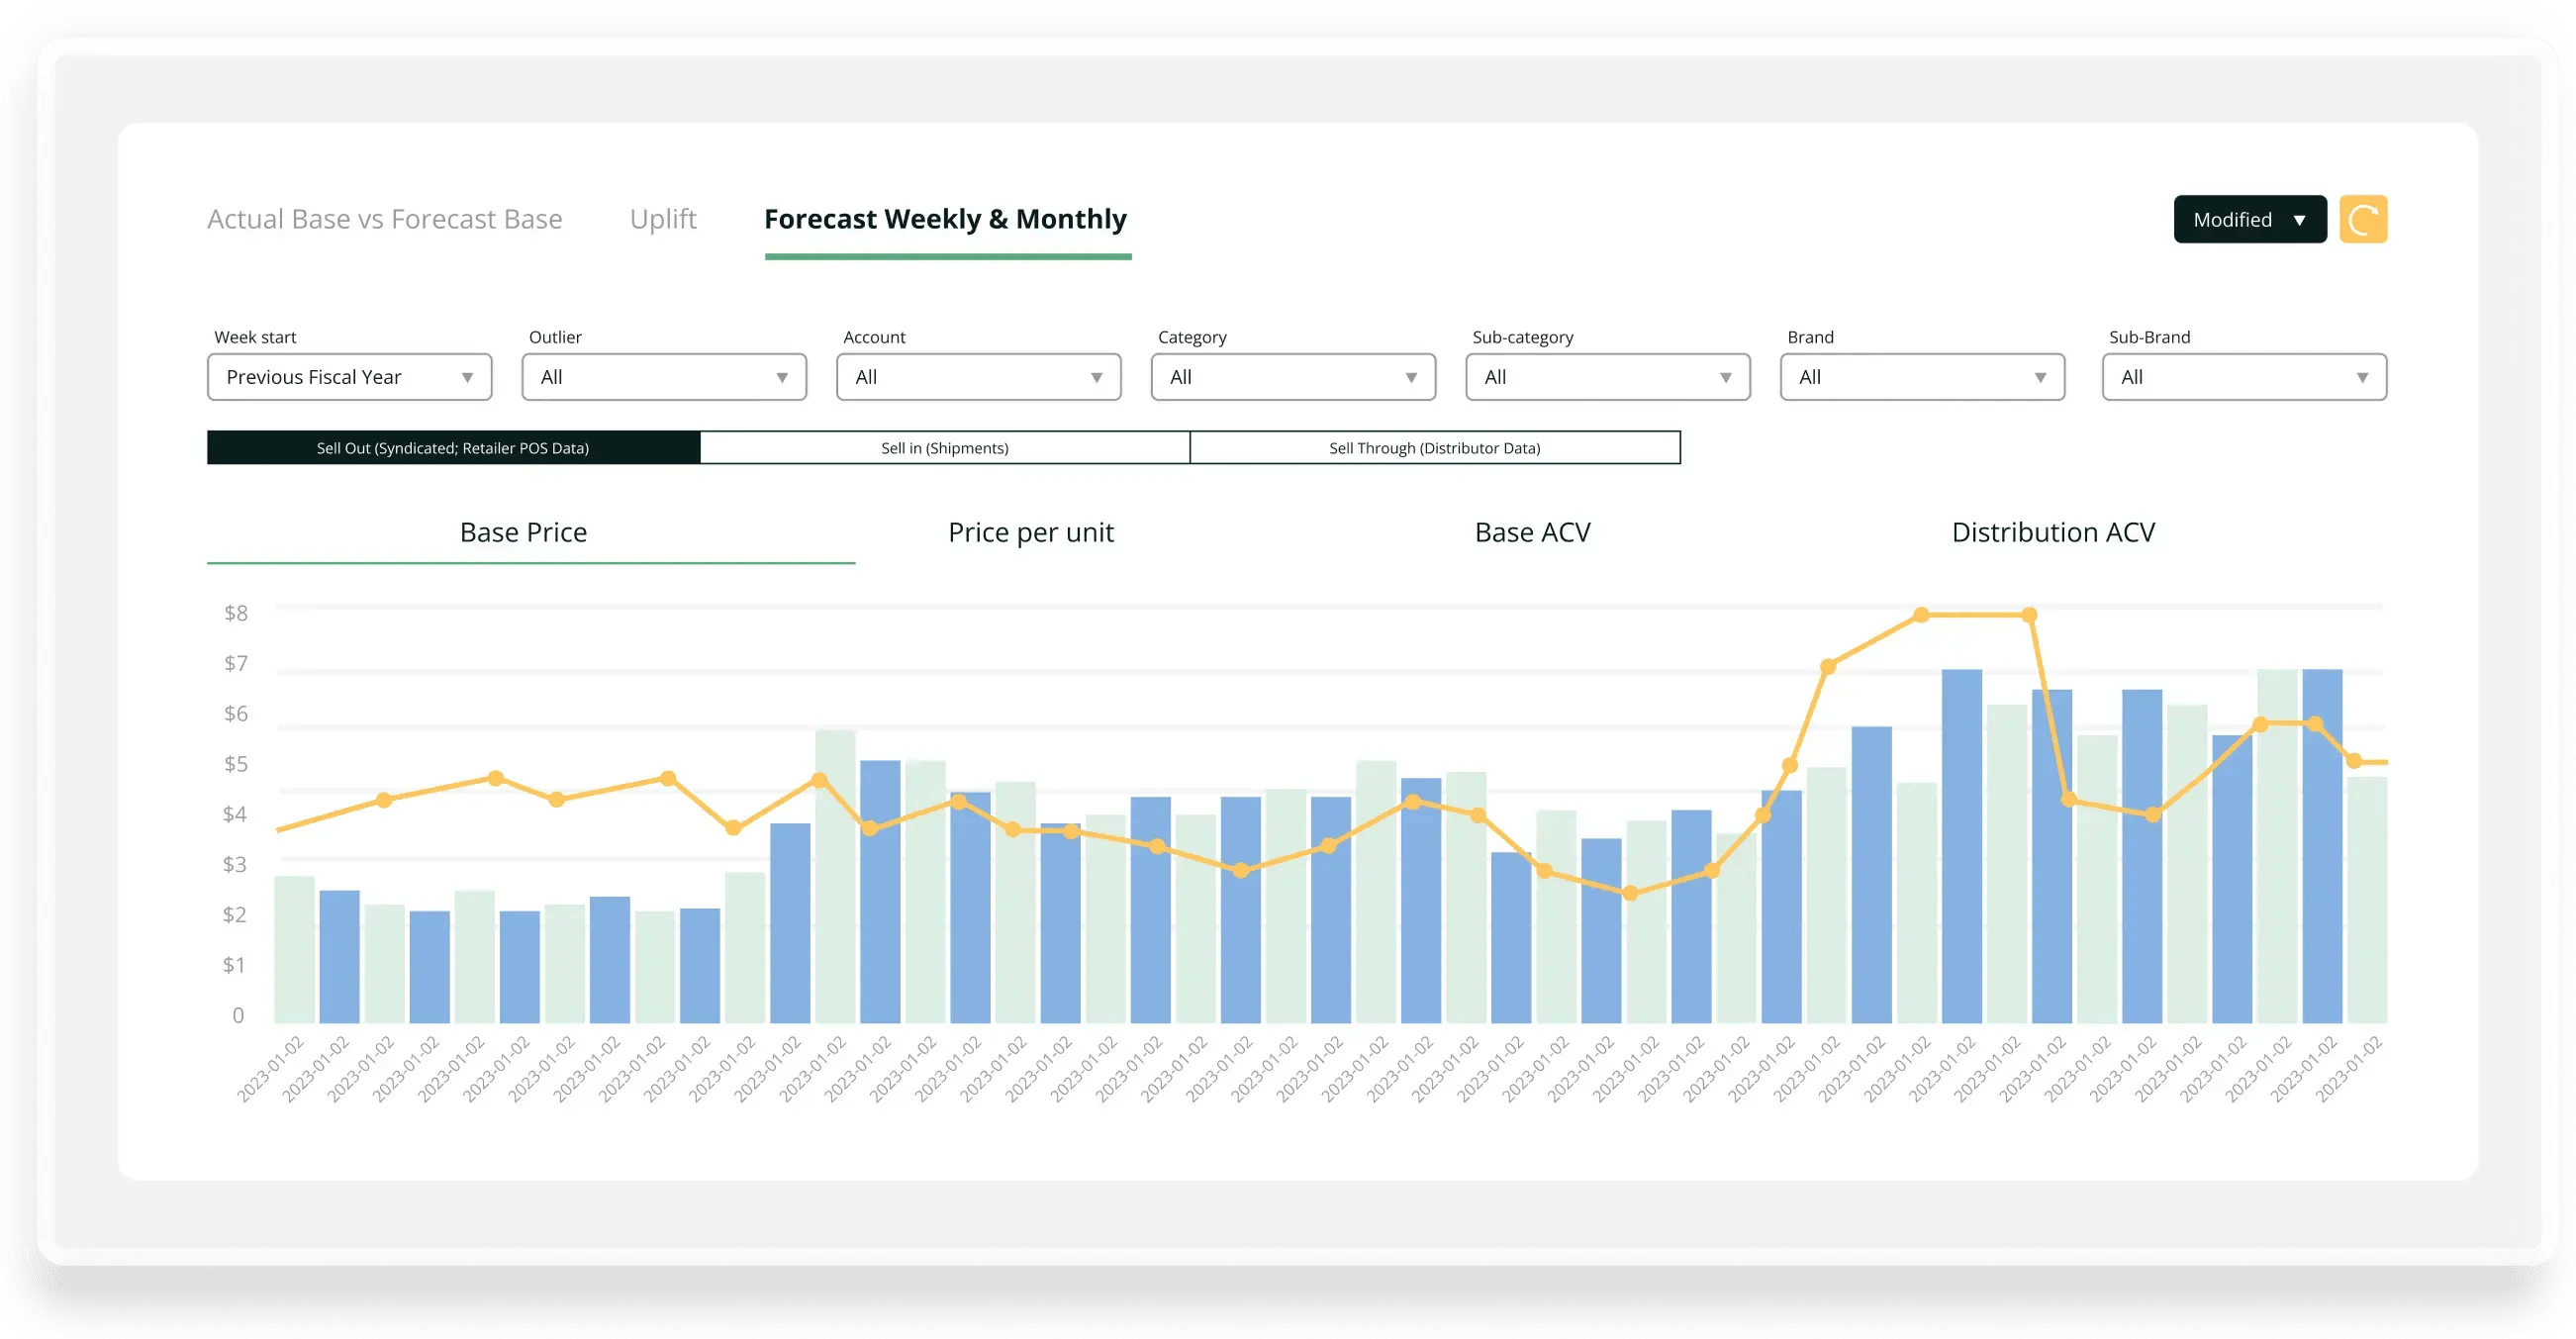
Accurate forecasting drives everything from promotion planning to supply chain efficiency as CPG companies strive to get the right product, in the right quantities to the right place at the right time. Our Forecast Reports provide critical insights into how the system is tracking volumes, comparing forecast base versus actuals, and highlighting the differences that matter.
These reports enable teams to:
- Compare system-generated forecasts against actual results
- Analyze variances between planned promotions and modeling predictions
- Make informed adjustments to future forecasting approaches
This clear view of planned versus model forecasts helps teams refine their prediction methodologies and build more accurate promotional strategies moving forward.
3. Account Reports: The Key Account Manager's Secret Weapon
For Key Account Managers (KAMs), having granular visibility into account performance is essential. Account Reports provide detailed insights into target vs plan versus actual performance across volume, revenue, and spending metrics, detailed account profitability reports and more.
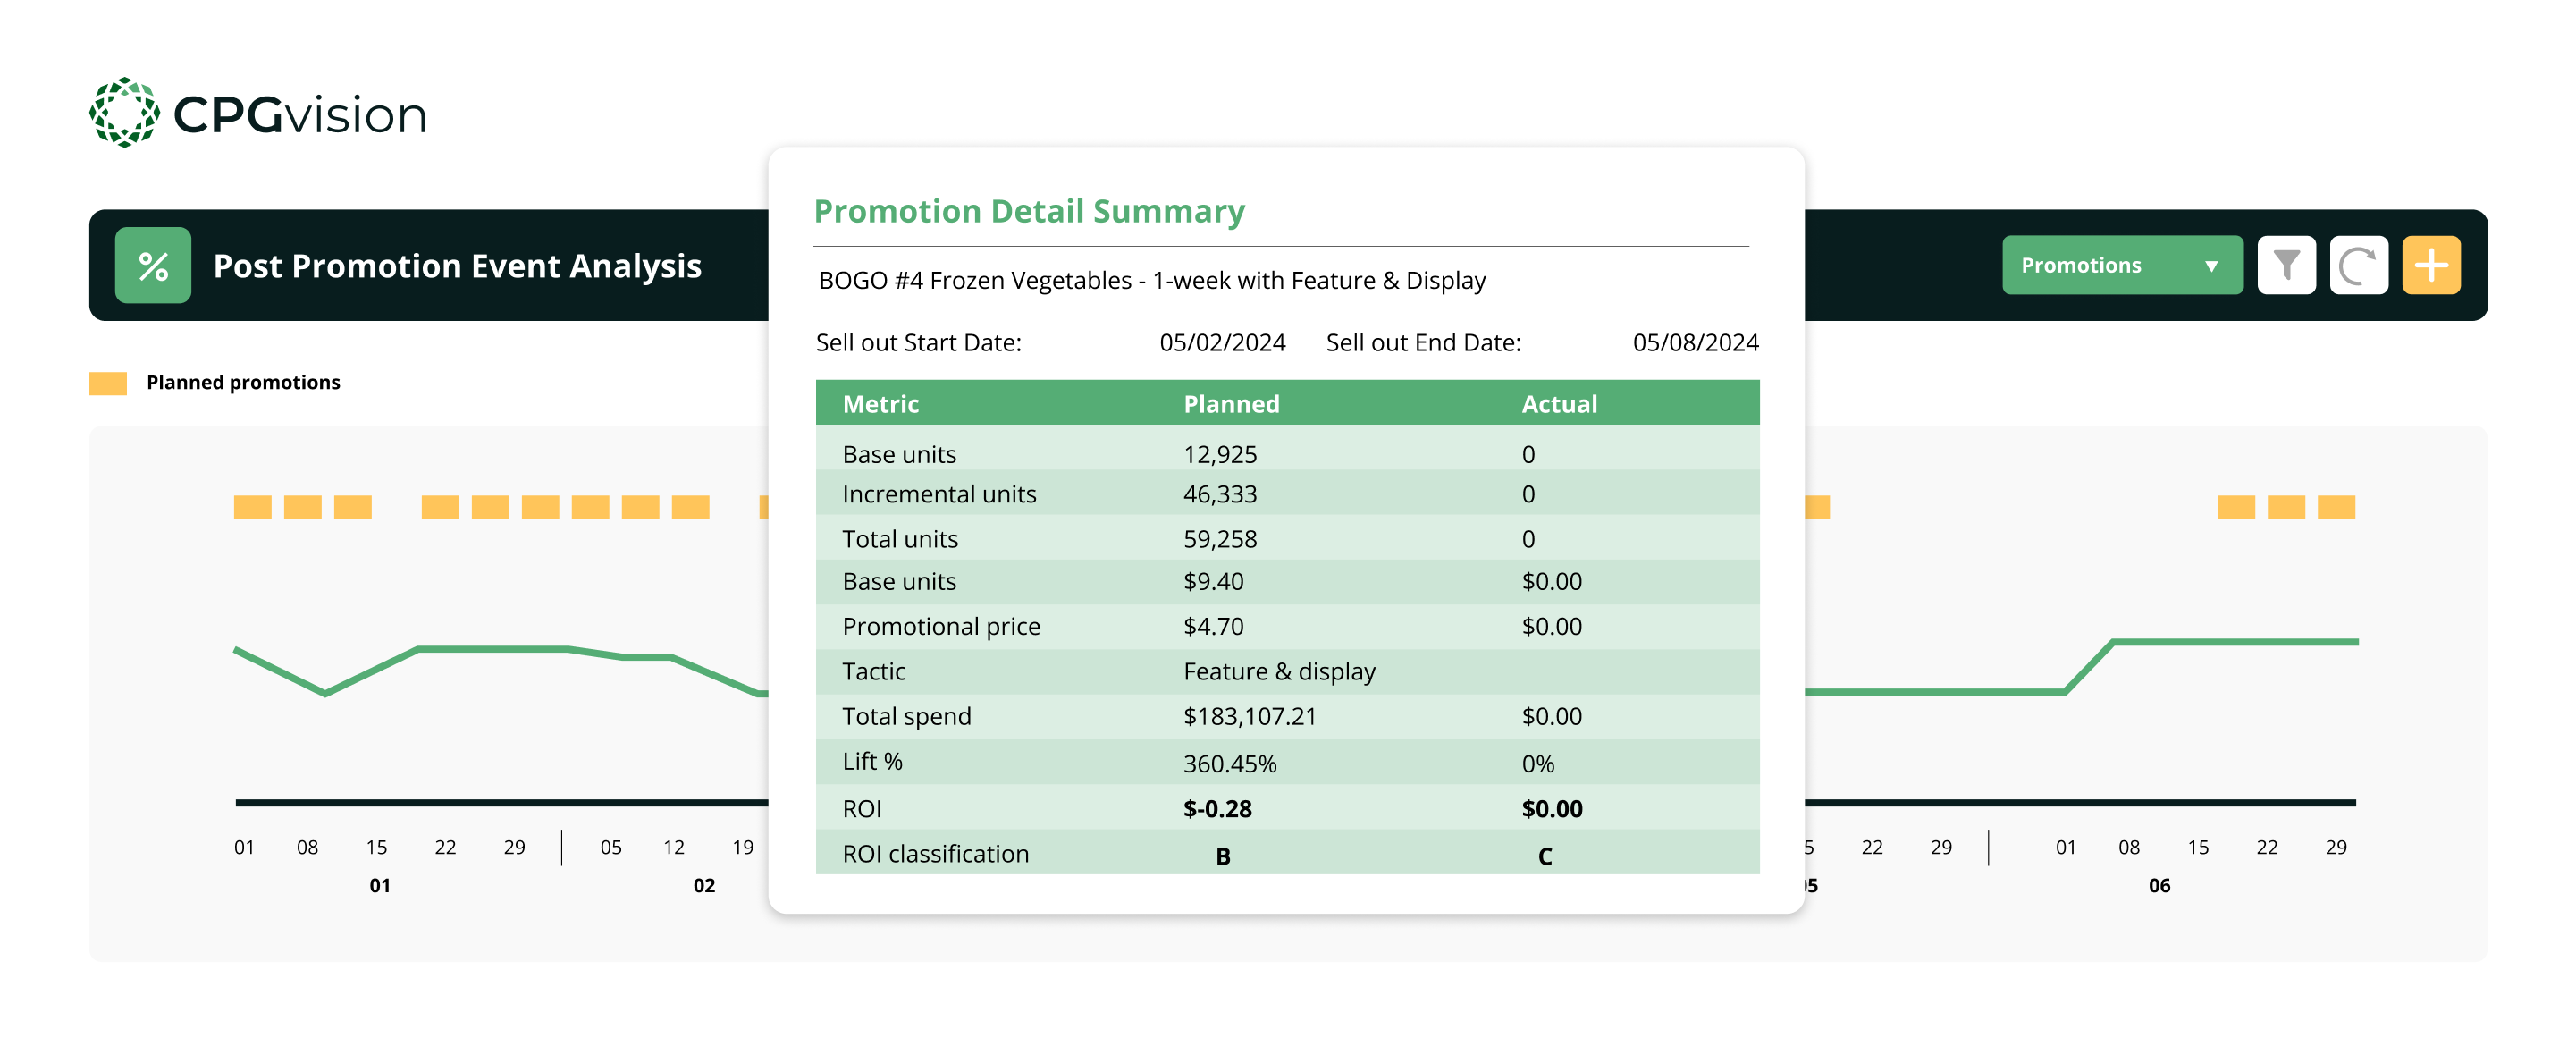
The crown jewel in this section of the insights suite is the post-promotion event analysis report. Here, KAMs can see a trend of their planned vs actual volume on a base and incremental basis, hover over events to see KPIs on a planned and actual basis and get a full understanding of This enables KAMs to quickly identify successful promotional strategies and course-correct underperforming tactics.
To see an overview of the post-promotion event analysis report, watch our brief video.
"As a KAM, the Post-Promotion Event Report has completely transformed my approach to customer meetings," says Shelley, a longtime user. "I can come prepared with concrete data about what worked, what didn't, and what we should try next."
4. Finance Reports: Follow the Money
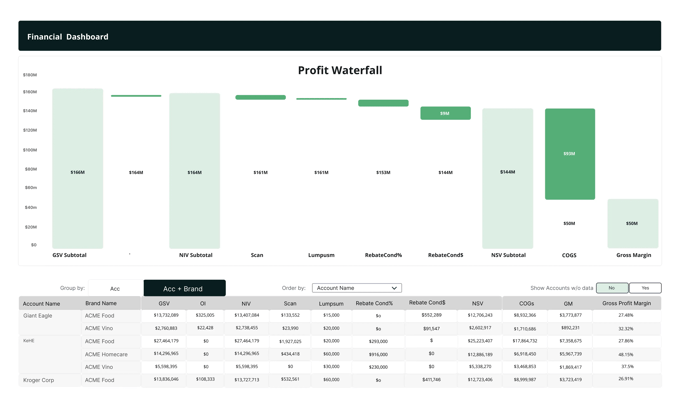
Finance teams need visibility into funds, budgets, settlements, accruals, and claims—and our Finance Reports deliver all of this. These reports provide clear insights into funding allocation, claim status (open vs. settled vs. disputed), and overall financial health.
Rather than forcing finance professionals to dig through data to find answers, these reports present key information through an intuitive, modern interface. Critical metrics are highlighted upfront, with the ability to drill down for more detailed analysis when needed.
This approach streamlines financial processes and enhances coordination between sales and finance teams, ensuring everyone works from the same financial truth.
We know finance teams love detail, and we have provided in-depth dashboards for each area, fund status, financial accruals, spending, settlements, month end, ledger and account reconciliation.
5. System Reports: Maximizing Your Investment
System Reports give administrators vital visibility into platform adoption and usage as well as system health. These reports help answer critical questions like: Are all users regularly logging in? Which system components see the most engagement? Is my data healthy?
System Reports help ensure your organization maximizes its software investment by tracking engagement and identifying areas where additional training or encouragement might be needed, and proactively identifying data or integrations issues so they can be quickly remedied without user interruption
Flexible Views and Filtering Across All Reports
What makes our reporting system truly powerful is its flexibility. All reports include:
- Standard filtering options for account and product attributes
- The ability to remove unnecessary filters based on your specific tracking needs
- Sub-filter views that let you analyze by month or quarter without changing your initial selection
- Multiple view options to focus on specific metrics like gross revenue or spending
This intuitive filtering system ensures that everyone from executives to account managers can quickly access the exact information they need without complex report configuration.
See just how powerful our report suite is by watching this video
Conclusion
In today's competitive CPG environment, having the right data at your fingertips isn't just helpful—it's essential. Our comprehensive insights suite delivers actionable insights to each stakeholder in your organization, from C-suite executives to key account managers to finance professionals.
By combining powerful analytics with intuitive interfaces, these reports turn data into decisions, helping your team optimize trade spending, improve promotional effectiveness, and ultimately drive bottom-line results.
Note: While 40 standard reports are available across these categories, specific report availability may vary by package.